SeSAMe2 (2.x, this command line) and sesame (1.x, the
R/Bioconductor package) are parallel, not sequential — one method, two
implementations. R: BiocManager::install("sesame"); shell:
conda install -c zhou-lab sesame.
GitHub· R / Bioconductor· R docs· YAME· InfiniumAnnotation· cinderplot· EPIC · EPICv2 · HM450 · MSA
Install & fetch — then fully offline
# the toolchain (sesame + yame is enough to run)
conda install -c zhou-lab -c conda-forge \
  sesame yame cinderplot tabl

# or build sesame from source
git clone --recurse-submodules \
  https://github.com/zhou-lab/sesame
cd sesame && make

# one-time: annotation into the shared store
# -y is required off a terminal; it refuses without
yame fetch -y EPICv2
yame fetch -y hg38

# a name is that directory's own files. -R adds everything
# beneath it (hg38/KYCG, hg38/models: 5.2 GB, mostly not
# sesame's). -n -R hg38 shows what that reaches first.
…builds a local, digest-verified store
($YAME_DATA_HOME, default ~/.local/share/yame) —
offline from here on:
EPICv2/  # probe annotation
├ EPICv2.ordering.tsv.gz
├ EPICv2.hg38.mask.cm(+.idx)
├ EPICv2.hg38.coord.tsv.gz
├ EPICv2.hg38.snp.tsv.gz
├ EPICv2.typeI_ext.tsv.gz
└ SHA256SUMS
hg38/  # genome tracks
├ seqinfo.tsv.gz  gaps.tsv.gz
├ cytoband.tsv.gz  genes.bed.gz(+.tbi)
└ SHA256SUMS
Preprocess — IDAT → betas
QCDPB (openSesame default) over a cohort in one process → YAME
.cg + qc.tsv.
# a folder of IDATs, searched recursively
sesame preprocess --out out/ in/

# or explicit prefixes (just betas)
sesame preprocess --output beta --out out/ \
  idat_prefix_1 idat_prefix_2
…writes one .cg per output over the cohort
(each with a .cg.idx of sample names) + qc.tsv:
out/
├ beta.cg (+.idx)          # betas (fmt4)
├ intensity.cg (+.idx)     # M/U (fmt3)
├ pval.cg (+.idx)          # detection p
└ qc.tsv                   # QC metrics
qc.tsv holds 66 per-sample metrics.
frac_dt — the fraction of probes above detection —
is the most critical for assessing data quality (also per type,
frac_dt_cg/_ch/_rs).
# head qc.tsv  (key columns)
sample    frac_dt  frac_dt_cg  frac_dt_rs
sampleA   0.978    0.979       1.00
sampleB   0.994    0.995       1.00
More knobs: --prep QCEPB swaps in
linear dye bias (E = dyeBiasL); --collapse
averages EPICv2/MSA replicate probes to their cg-prefix (betasCollapseToPfx);
--detection pneg emits the negative-control-ECDF detection p;
and GCT (bisulfite conversion) joins qc.tsv on every platform.
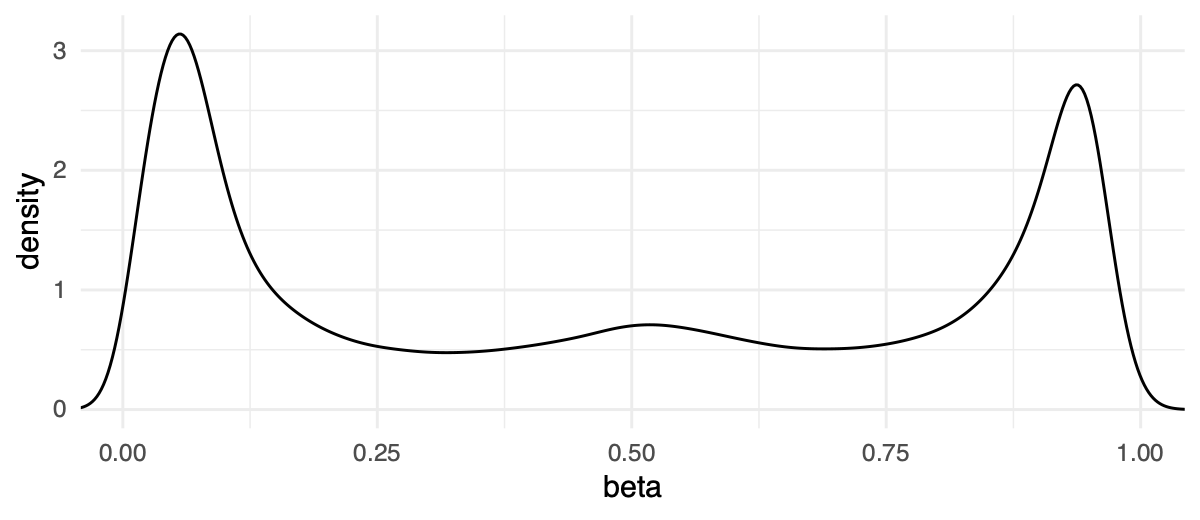
# betas -> a 1-D density (bimodal)
yame unpack beta.cg | cinderplot --no-header \
  'aes(V1) + geom_density()
+ theme_minimal() + labs(x="beta")' beta_density.pngRead a .cg back — describe-probe
Betas and signals are stored positionally — one value per probe, in a fixed
order, with no Probe IDs inside. The IDs live once in the platform's
ordering table, which is what keeps the files small and byte-for-byte
alignable: stack N samples into a matrix by column with no key-matching.
describe-probe joins the two back into a labelled TSV.
$ sesame describe-probe out/beta.cg
Probe_ID          206909630040_R03C01
cg00000029_TC21   0.9124
cg00000769_BC11   0.0331
# the ordering is inferred from the row count -- each
# platform's is a distinct length. Name it if you'd rather:
$ sesame describe-probe --platform EPICv2 out/beta.cg
# --all for every sample column (matrix)
# the other direction: probe IDs -> coordinates, for yame rowsub -L
$ sesame describe-probe --platform HM450 --genome hg38 probes.txt
cg00000029        chr16_53434200
Peek at a raw IDAT — idat-dump
The bead-level record as Illumina wrote it, before any of it becomes a probe.
$ sesame idat-dump --tsv sample_Grn.idat.gz
# rows only: addr, mean, sd, nbeads. The header
# belongs to the summary form (no --tsv).
10600313   4821  118  12
10600322   287   34   9
Array QC plots — preprocess → cinderplot
The two diagnostics from sesame's
supplemental QC,
with no R in the loop: preprocess writes the signals,
describe-probe labels them,
tabl reshapes them, and
cinderplot draws them.
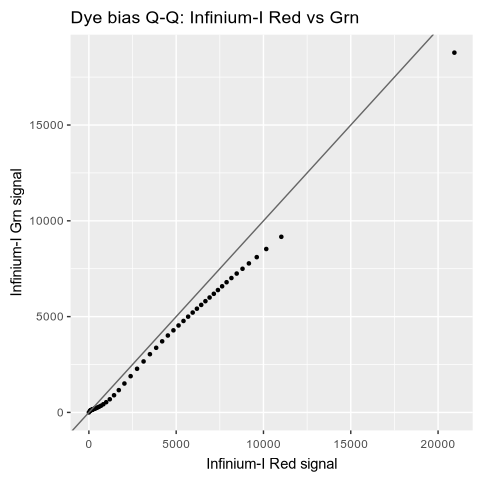
sesame preprocess --prep C --output intensity --out qc/ $PFX

# --with col carries the ordering's channel through; then pool each
# channel's in-band {M,U} and read off a matched quantile grid
sesame describe-probe --with col qc/intensity.cg \
| tabl filter 'col=="R" || col=="G"' \
| tabl longer -c 3:4 -v sig \
| tabl quantile -g col -n 51 sig --wider > qq.tsv

cinderplot 'qq.tsv + aes(R, G) + geom_point(size=1.2)
  + geom_abline(slope=1, intercept=0, colour="grey40")
+ labs(x="Infinium-I Red signal", y="Infinium-I Grn signal")' qq.png --size 5x5--prep CD and the
curve should land on the line. Ports sesameQC_plotRedGrnQQ().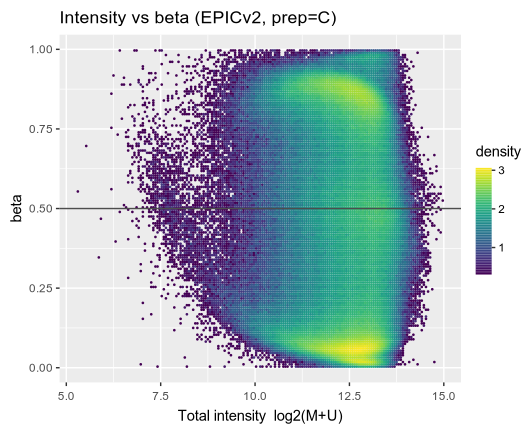
sesame preprocess --prep C --output intensity,beta --out qc/ $PFX

# both .cg are positional to the same ordering, so describe-probe puts
# them side by side -- no join. Then bin onto a 180x140 grid.
sesame describe-probe qc/intensity.cg qc/beta.cg \
| tabl rename M=2 U=3 beta=4 \
| tabl mutate 'logint=log2(M+U)' \
| tabl bin2d -x logint -y beta -nx 180 -ny 140 --xlim 5,15 --ylim 0,1 \
| tabl mutate 'density=log10(n+1)' > qc/ib.tsv

cinderplot 'qc/ib.tsv + aes(x, y, colour=density) + geom_point(size=0.7)
  + geom_hline(yintercept=0.5, colour="grey30") + scale_colour_viridis()
+ labs(x="Total intensity log2(M+U)", y="beta")' ib.png --size 5.5x4.5sesameQC_plotIntensVsBetas().Differential methylation — dml
Per-probe OLS with t/F tests + BH, matching R's lm to ~1e-9.
dml is the one command that takes no
--platform: a .cg is
positional, so it needs the ordering itself, by path
($STORE = $YAME_DATA_HOME).
It still prints a deprecation notice for --index,
which is the only flag it has — the rename has not reached it.
sesame dml --betas out/beta.cg \
  --index $STORE/EPICv2/EPICv2.ordering.tsv.gz \
  --meta samples.tsv \
  --formula '~ group + age' > dml.tsv
De-identify — deidentify
Strip the genetic fingerprint: zero (or reversibly scramble) the SNP
(rs) probe intensities in an IDAT — every other bead
is byte-identical, so betas are unchanged except the SNPs.
# zero SNP beads (a prefix does both channels)
sesame deidentify sample_prefix

# or reversibly scramble, then restore
sesame deidentify --randomize --seed 42 s.idat
sesame deidentify -r --seed 42 s_noid.idat
Copy number — cnv
OLS vs a normal panel → log2 → genome bins → CBS (DNAcopy port). Two output files.
sesame preprocess --prep "" --raw-signal \
  --output total_intensity --out t/ tumor
sesame cnv --platform EPICv2 \
  t/total_intensity.cg segments.tsv bins.tsv
# --probes: per-probe; --exclude chrY
The normal panel ships with the annotation
(<P>.cnvnormals.cg, v8.2+), so
yame fetch brings it; --normals
points at your own instead.
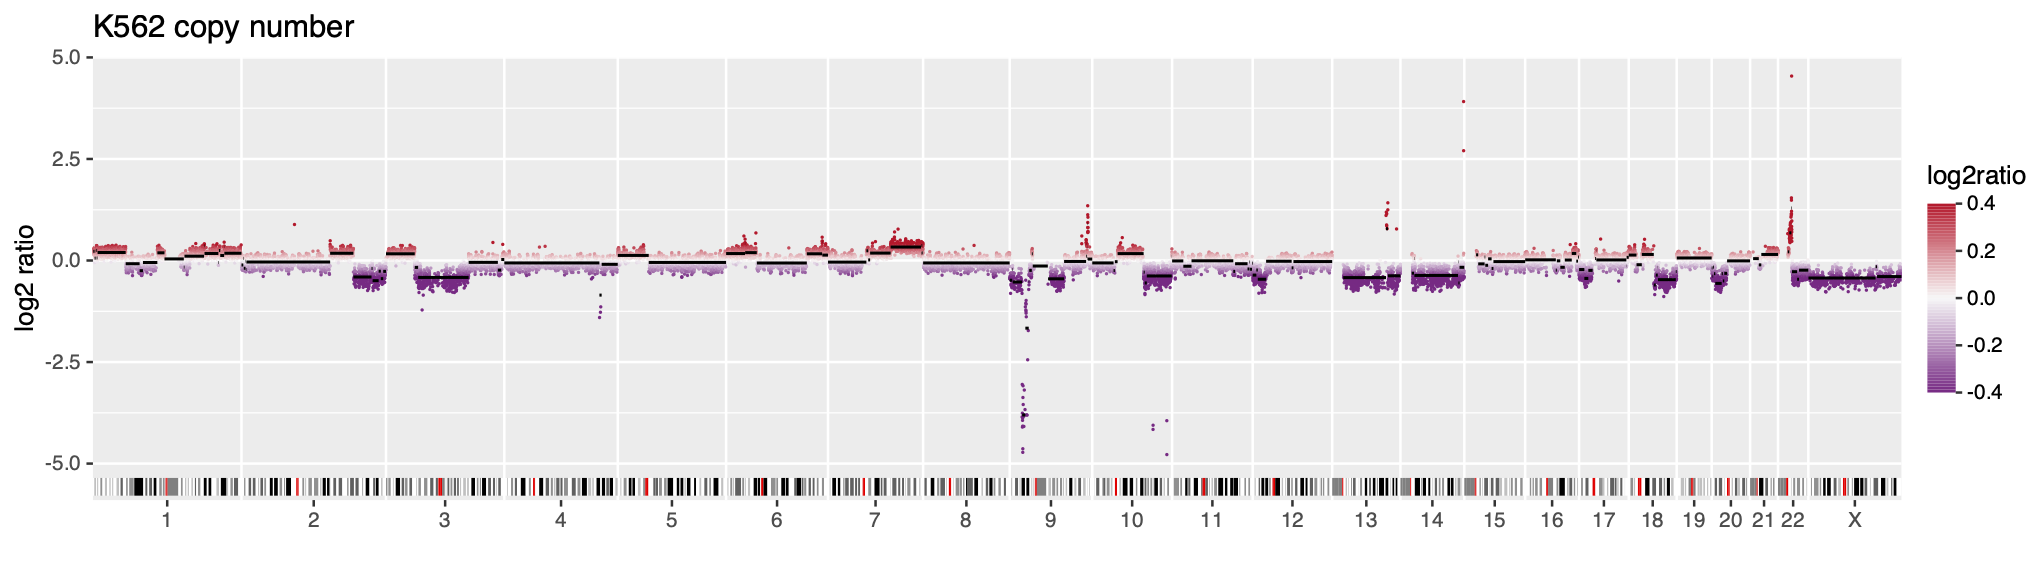 cnv">
cnv">
# plot the two files with cinderplot
cinderplot 'out/bins.tsv
  + aes(chrom=chrom, x=start, xend=end, y=log2ratio, colour=log2ratio)
  + geom_point(size=.5)
  + geom_segment(data="out/segments.tsv", y=seg.mean, color="black")
  + scale_x_genome("hg38/seqinfo.tsv.gz")
  + scale_colour_gradient2(low="#762a83", high="#b2182b")
+ ideogram("hg38/cytoband.tsv.gz")' cnv_k562.pngGenotype SNPs → VCF — vcf
SNP (rs) probes → VCF (formatVCF); GT + fractions exact vs R.
sesame vcf tumor --platform EPICv2 > geno.vcf
# the SNP table comes from the store. --snp
# overrides it, and is a path -- a bare
# filename is not looked up in the store.
# --variants: only rs + channel-switch
Region & gene views — region → cinderplot
A locus's betas as long-form TSV → cinderplot over the gene models in zhou-lab/genomes.
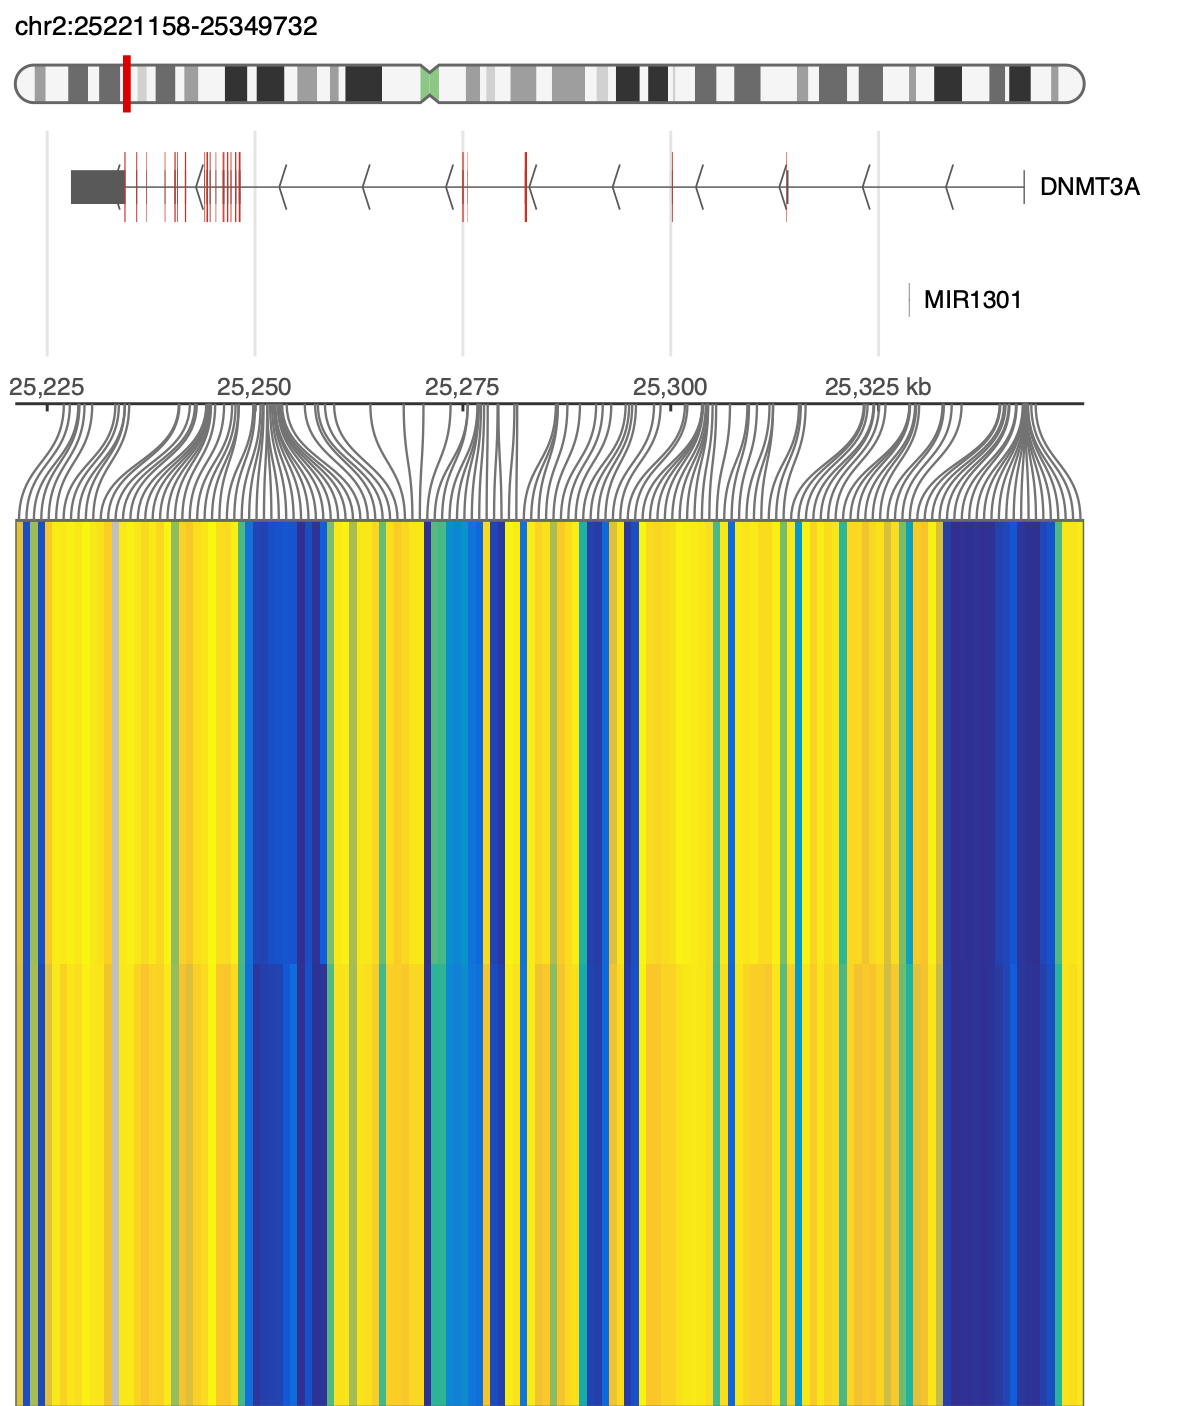
sesame region --gene DNMT3A --pad 2000 \
  --betas cohort.beta.cg --platform EPICv2 \
| cinderplot 'region()
  + cytoband("hg38/cytoband.tsv.gz", height=.5)
  + genes("hg38/genes.bed.gz", height=1.5)
  + matrix(-, cluster=samples, rownames=off)' dnmt3a.png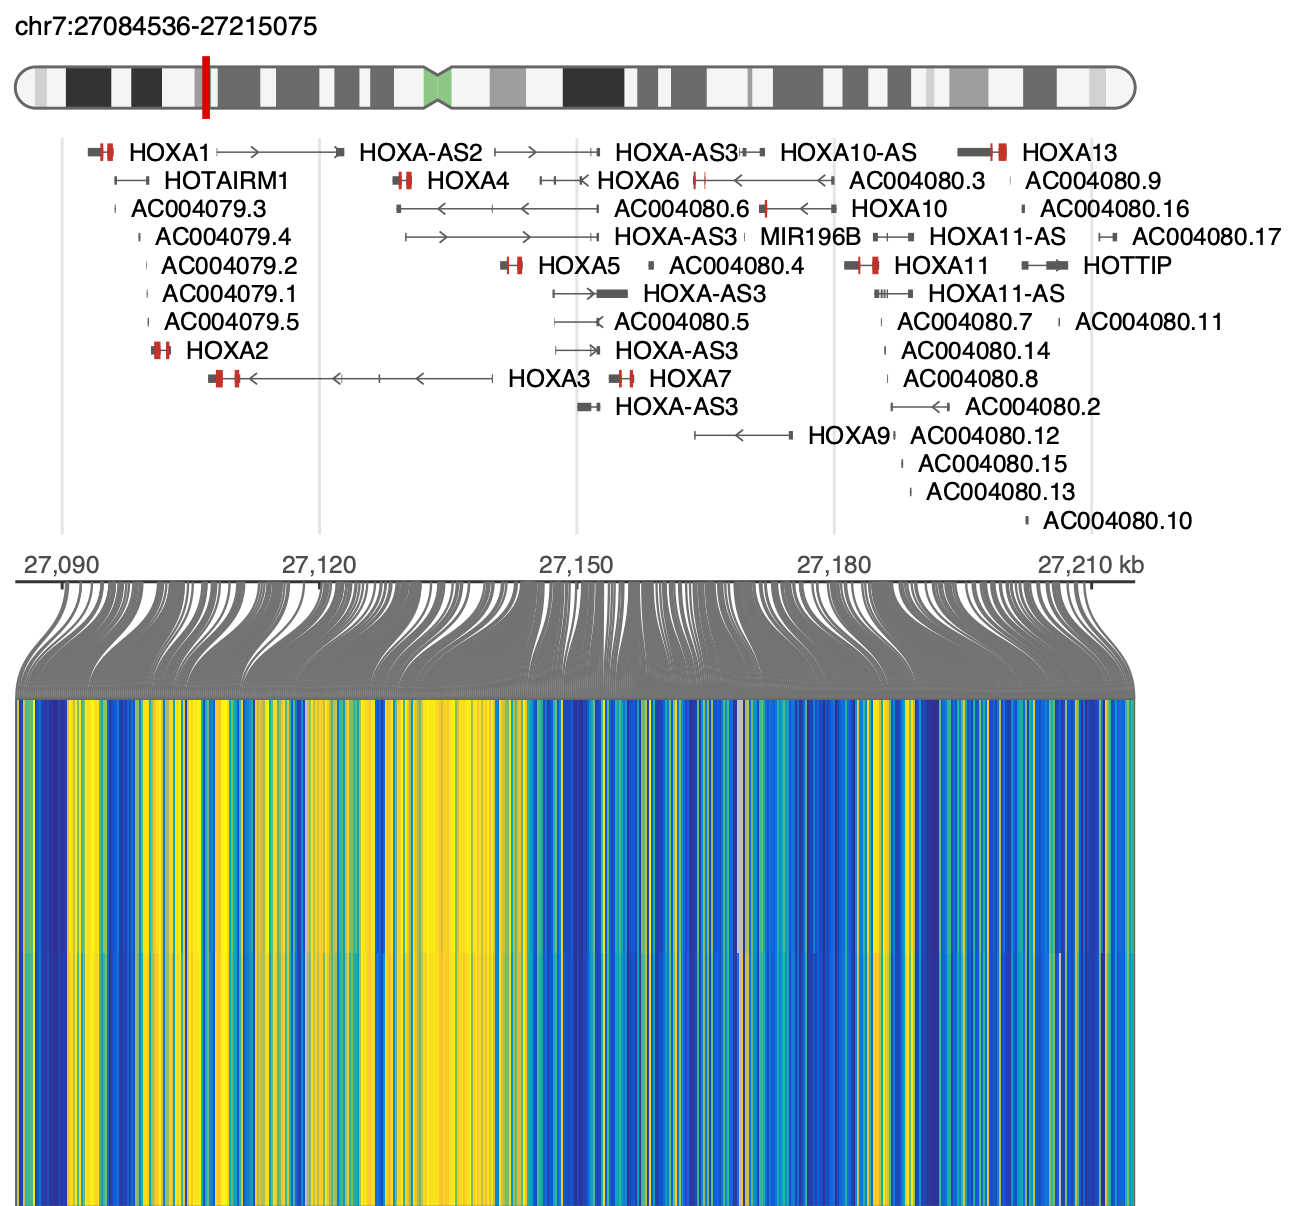
sesame region chr7:27,090,000-27,210,000 \
  --betas cohort.beta.cg --platform EPICv2 \
| cinderplot 'region()+genes()+matrix(-)' hoxa.pngWhere we differ from R — DIVERGENCES.md
R is the oracle, and nearly everything matches it to the ULP. The exceptions are listed — not rounded away — in DIVERGENCES.md, each with what differs, why, and the measurement that settled it.
Most of them are not arithmetic at all: the two programs read
different annotation. sesame reads the store
(InfiniumAnnotation v8.1); R reads the copy inside
sesameData. Where those disagree — 22 EPICv2 SNP
probes whose colour channel differs, 635 EPIC control probes named
ctl_10609447_NEGATIVE here and
ctl_10609447 there — the newer annotation is the
one this build is correct against.
# the tests grade against frozen values, not a live R
tests/truth/vcf.EPICv2.tsv.gz   # 127,572 rows, 22 C-sourced
tests/truth/PROVENANCE.tsv      # R, sesame, sesameData, store

# regenerating refuses to freeze an unexplained value
make truth RSCRIPT=Rscript-4.6.0
Speed — vs the R package
One EPICv2 sample, IDAT → betas, median of 3. R is timed twice: the
openSesame() call alone, and the whole invocation —
startup and library(sesame) included — which is what a
pipeline pays, since it starts a fresh R per sample.
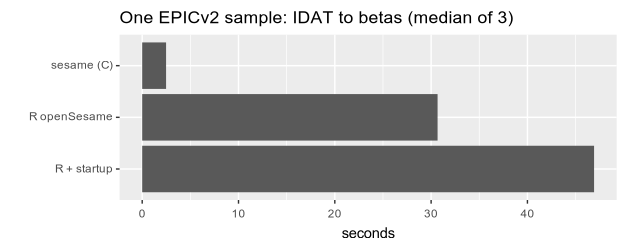
tools/bench_vs_r.sh $PFX EPICv2 3Betas utilities — mliftover · impute
Post-process a beta.cg → beta.cg,
positional to the platform ordering.
# lift betas across platforms (mLiftOver)
sesame mliftover --to EPIC --platform EPICv2 \
  beta.cg beta.EPIC.cg

# into a genome's CpG universe, as M/U pseudo-counts --
# what a whole-genome model (methscope classify) reads
sesame mliftover --to hg38 --platform MSA \
  --simulated-depth 100 beta.cg beta.hg38.cg

# a whole-genome model's mask down to the array
sesame mliftover --to MSA --platform hg38 \
  model.mrmp model.MSA.mrmp

# fill NA betas (mean / genomic neighbours)
sesame impute --method mean beta.cg out.cg
sesame impute --method neighbors \
  --platform EPICv2 beta.cg out.cg
mliftover is one index-to-index map applied one
way: array→array joins on probe-ID prefix (EPICv2↔EPIC↔HM450); array↔genome
joins on coordinate, through the platform's coord table and the genome's
cpg_nocontig.cr, built in memory each run (~2 s, nothing to
fetch). Only cg probes cross, decided by ID — an rs or nv probe
carries genotype, not methylation, wherever it maps; replicates on one CpG are averaged;
cg probes with no CpG row are dropped; every count is reported. The way back is lossy —
CpGs under no probe are gone.
Any format lifts, a .cm mask included; --threads N
runs the records across workers that share the one map. impute fills NAs by the probe's cross-sample mean,
or the nearest same-strand genomic neighbours (imputeBetas*).
Both are local fills — a neighbouring CpG or the column
mean — and they only reach probes the array already carries. For imputation as
an inference problem, use
methscope:
methscope upscale predicts genome-wide CpG methylation
from a sparse methylome with a trained model, which is both more accurate and
not limited to the manifest.
Citation — the SeSAMe papers
SeSAMe2 is a C reimplementation of the SeSAMe method family. Please cite the work behind the parts you use:
- Infinium annotation & masking — Zhou, Laird & Shen. Nucleic Acids Research 2017. 10.1093/nar/gkw967
- SeSAMe / pOOBAH — Zhou, Triche, Laird & Shen. Nucleic Acids Research 2018. 10.1093/nar/gky691
- mLiftOver — Chen & Zhou. Bioinformatics 2024. 10.1093/bioinformatics/btae423
- KnowYourCG (KYCG) — Goldberg et al. Science Advances 2025. 10.1126/sciadv.adw3027
- MSA array — Goldberg et al. Cell Genomics 2025. 10.1016/j.xgen.2025.100929
- ELBAR / low-input — Lee et al. Nucleic Acids Research 2024. 10.1093/nar/gkae127
- Cross-species analysis — Ding, Kaur, Horvath & Zhou. Briefings in Bioinformatics 2023. 10.1093/bib/bbac617
- MM285 mouse array — Zhou et al. Cell Genomics 2022. 10.1016/j.xgen.2022.100144